Intelligence BuildoutMethodology

Matter — complete text edition

Volume I / Text edition

Matter

Materials + chemistry. 13 spreads and 26 pages, with the complete evidence-linked content. No JavaScript is required.

Volume I

Matter

Materials + chemistry · 26 pages

Follow the physical inputs beneath AI—from mineral feedstocks and electronic-grade silicon to process chemistry, structural materials, qualification, and recovery.

01

From ground to specification

The useful resource is not merely what exists underground, but what industry can refine, qualify, and deliver with repeatable properties.

Spread 01 / The industrial origin

Volume I · Orientation

Intelligence begins as matter

Before a model becomes software, its infrastructure is a negotiated chain of physical transformations.

AI hardware begins far outside a data hall. Rock becomes purified feedstock; feedstock becomes wafers, conductors, gases, coatings, structures, and cooling systems. Each transformation requires its own equipment, energy, workforce, process knowledge, and geography. The result is not one supply chain but many tightly timed chains that converge at fabrication, assembly, system manufacturing, and construction.Claim

The critical distinction is between geological availability and production readiness. A mineral may be common yet useless to a fab until it has been separated, refined to a controlled specification, qualified in a particular process, packaged without contamination, and delivered reliably. That is why small upstream failures can idle extraordinarily valuable downstream assets.Claim

Reading rule: Treat every material as a chain of conversion, specification, qualification, and delivery—not as a name on a bill of materials.
Minimum fields for a decision-grade material ledger
FieldQuestion it must answer
Form and gradeWhat physical or chemical specification does the consuming process accept?
TransformationWhich refining, conversion, or finishing step creates the usable input?
QualificationWhich supplier, site, container, and recipe combination has passed production evidence?
RecoveryWhat inventory, alternate route, repair, reuse, or recycling option can bridge an outage?
BoundaryWhich upstream utilities, logistics, hazards, and waste streams remain outside the quoted BOM?
The material system sets the feasible boundary for every later volume.

System map

Five gates between resource and use

Capacity exists only when every gate can pass production material at the required quality and cadence.

Extraction determines which ore, brine, or industrial by-product enters the chain. Refining separates and purifies it. Conversion gives it a usable form: a wafer, gas, slurry, foil, cable, beam, or powder. Qualification proves that a supplier and formulation behave consistently inside a customer's process. Logistics preserves that condition until use.

AI demand reaches all five gates unevenly. Bulk concrete can be regionally sourced, while an electronic chemical may come from a handful of qualified facilities. Planning therefore has to follow each input to the narrowest transformation step, not stop at a country's reserves or a supplier's announced nameplate capacity.

Material readiness chain
  1. Recover— Extract or capture a usable feedstock.
  2. Refine— Control purity and composition.
  3. Form— Create the geometry or chemical grade a process consumes.
  4. Qualify— Demonstrate repeatability in a specific production route.
  5. Deliver— Protect identity, purity, and timing through logistics.

The narrowest gate is not automatically the rarest element. It may be a purification train, a qualified cylinder, a port route, a customer approval, or the time needed to restore a contaminated line. Audit each gate with three clocks: inventory coverage, physical recovery, and qualification recovery. Then test whether an alternate merely moves the constraint downstream. A substitute that reduces material exposure but increases defectivity, power, corrosion, or tool downtime has changed the failure mode rather than removed it.

Spread 02 / Quartz to polysilicon

Feedstock · Silicon

Quartz is an origin, not a wafer

The familiar element becomes a semiconductor input only after several industrial transformations.

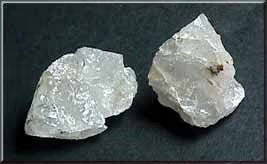
Clear quartz crystals resting on pale rock.

A quartz specimen shows the geological starting point for silicon-bearing feedstock.

This documentary image depicts natural quartz, not electronic-grade polysilicon, a crystal-growth ingot, or a finished wafer.USGS marks the media item public domain. Credit is retained for provenance.U.S. Geological Survey, public domain.Original sourceU.S. government work / public domain

Silica-bearing material is reduced to industrial silicon, then chemically converted and purified into semiconductor-grade polysilicon. The sequence is designed to remove contaminants that ordinary material markets tolerate but device manufacturing cannot. The usable product is therefore the output of reactors, distillation, deposition, quality control, and traceable handling—not simply mined quartz.

An industry submission describes semiconductor-grade polysilicon as generally requiring at least eleven nines of purity. The figure should be read as a stakeholder description of accepted requirements, but it conveys the central point: the value lies in controlled absence—keeping unwanted atoms out at extraordinary levels.Claim

Control points hidden inside the word purification
  1. Convert— Move silicon into a chemical form that can be repeatedly separated from impurities.
  2. Purify— Use staged separation while monitoring trace metals, dopants, moisture, and particles.
  3. Deposit— Return purified silicon to a controlled solid form without reintroducing contamination.
  4. Protect— Preserve lot identity and cleanliness through breakage, packaging, storage, and transport.
  5. Release— Accept a lot against measurements tied to crystal growth and finished-device behavior.

Market structure

Purity concentrates the supplier base

The tighter the specification, the smaller the set of facilities that can repeatedly meet it.

SIA reported that two suppliers together account for roughly three quarters of semiconductor-grade polysilicon supply. That is a time-sensitive industry position, not a permanent market law, yet it illustrates why feedstock concentration matters. A fab cannot automatically replace a qualified source with nominally similar material when trace impurities, packaging, and process history differ.Claim

New capacity must complete a customer-specific learning cycle. Samples are characterized, introduced carefully, compared against known baselines, and monitored across finished devices. That makes resilience slower than buying more commodity inventory. It may require parallel qualifications, long-term agreements, process adjustments, and disciplined storage before a disruption appears.

Do not collapse these terms
Purity
How much unwanted material remains.
Consistency
How tightly lots repeat the same properties.
Qualification
Evidence that a specific material works in a specific process.
Capacity
Output that can actually meet specification and be delivered.
Evidence boundary: The purity and supplier-share statements on this spread are labeled stakeholder positions because their source is an industry filing.
Capacity claims require a qualification denominator
ClaimEvidence needed before planning against it
Nameplate outputOperating rate, grade mix, maintenance constraints, and saleable yield
Semiconductor gradeImpurity profile, lot consistency, handling system, and customer specification
Available supplyCommitted volume, inventory position, logistics, and allocation rules
Alternate sourceProduction-equivalent trials, change control, device results, and approval lead time

Spread 03 / Crystal to wafer

Form · Single crystal

A wafer is manufactured geometry

Purified feedstock must become one controlled crystal before it can carry billions of patterned devices.

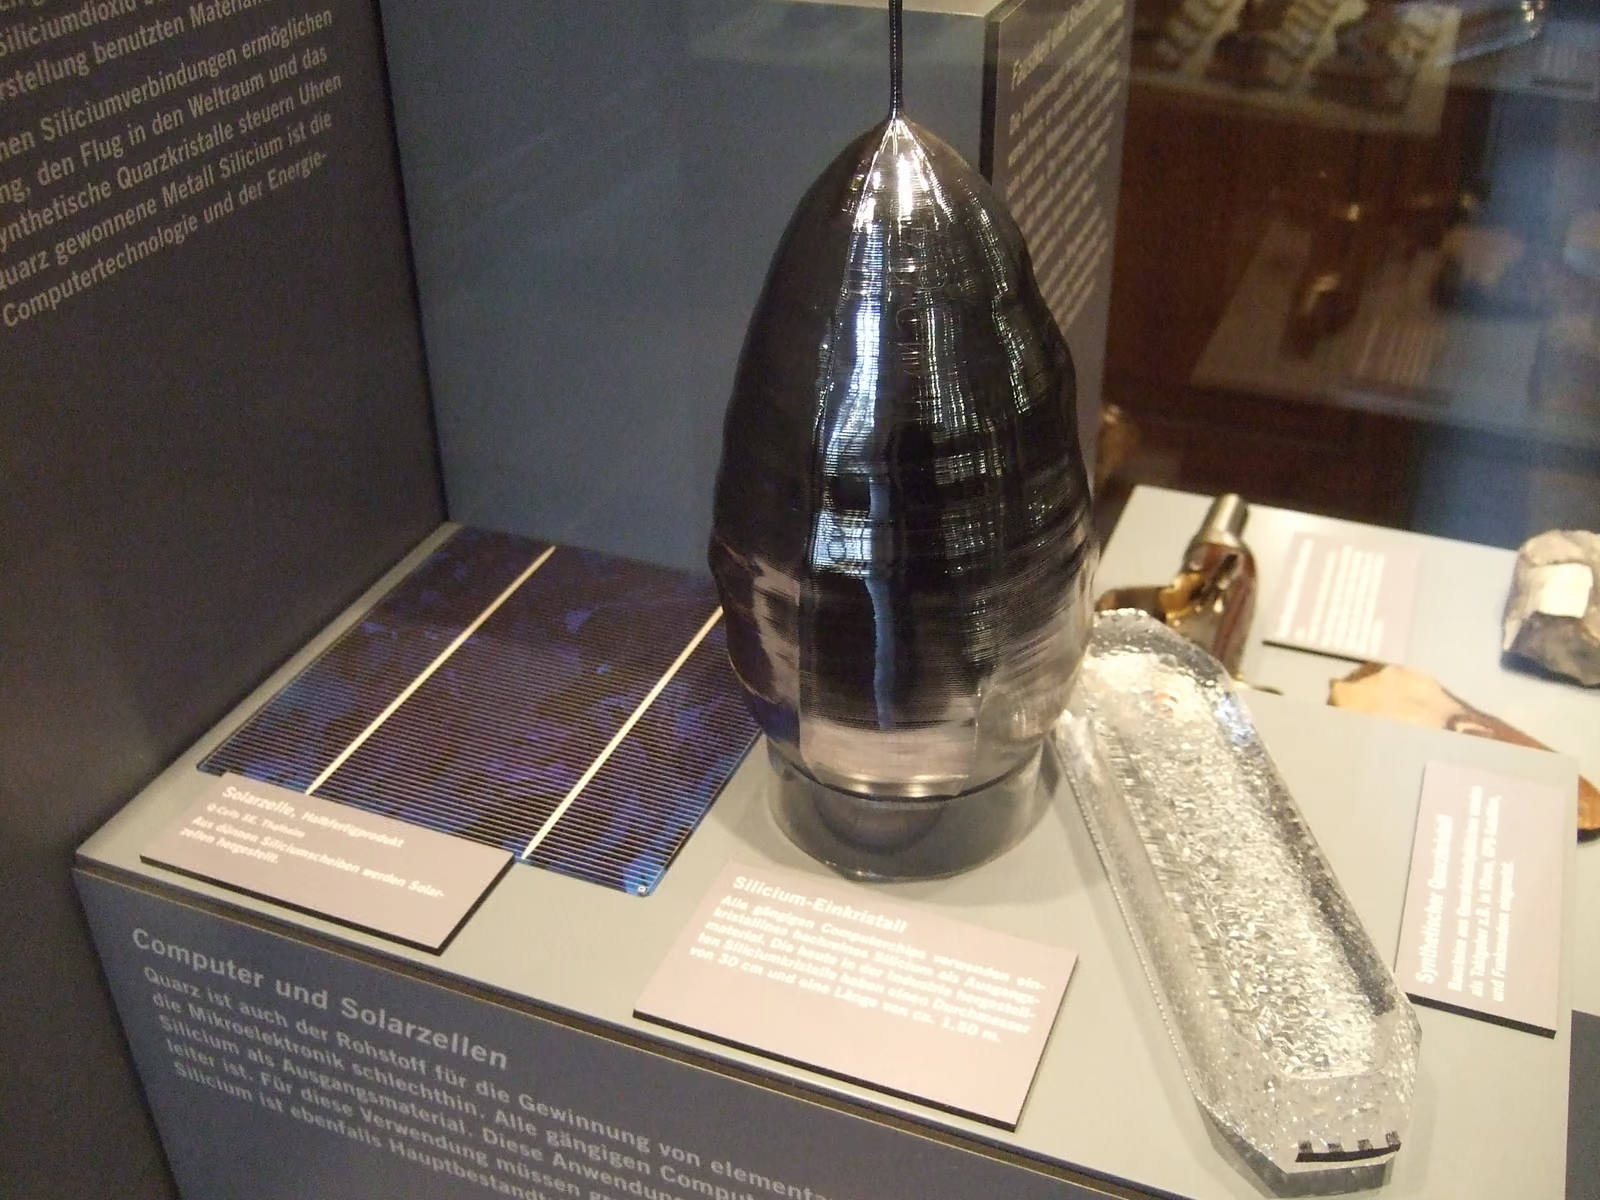
A cylindrical single-crystal silicon boule displayed upright in a museum case.

A silicon crystal-growth boule documents the cylindrical form from which wafers are sliced.

The image shows an industrial silicon boule; it does not depict a patterned logic wafer or certify a particular process node.The creator released the image into the public domain worldwide. The pictured boule is a museum object, not a current production line.Sebastian Wallroth / Wikimedia Commons, public domain.Original sourcePD-self public-domain release

Electronic-grade polysilicon is melted and grown into a single-crystal ingot while crystal orientation and dopant conditions are controlled. The cylinder is shaped, marked for orientation, and sliced into thin discs. Those slices still require edge treatment, lapping, chemical processing, polishing, cleaning, and inspection before a fab can accept them.

Every step manages a different failure mode: lattice defects, residual stress, particles, surface damage, warp, thickness variation, and trace contamination. A substrate is therefore both raw material and precision component. Its invisible deviations can reappear later as lost die, unstable devices, or process drift.

What a wafer acceptance audit should separate
  • Crystal integrity: orientation, dopant uniformity, oxygen or carbon behavior, and defect populations.
  • Geometry: diameter, thickness, edge profile, bow, warp, flatness, and usable edge exclusion.
  • Surface condition: roughness, polishing damage, haze, particles, metals, and organic residue.
  • Traceability: boule, slice, polish line, inspection method, container, and shipping history.
  • Downstream evidence: how incoming measurements correlate with process excursions and die yield.

Format · Factory interface

The disc standardizes an entire ecosystem

Wafer diameter connects crystal growth to carriers, robots, process chambers, recipes, and factory economics.

ASML's manufacturing overview identifies the 300-millimeter wafer as the format most often used in semiconductor manufacturing. The dimension is more than a physical measurement: equipment handling, lithography fields, process uniformity, wafer maps, and fab automation are organized around the substrate.Claim

A larger usable area can carry more die, but only if film thickness, temperature, focus, overlay, and cleanliness remain controlled across the full surface. Edge exclusion and defective regions reduce usable output. The economic value of a wafer therefore emerges later, after hundreds of coordinated operations turn blank crystal into known-good die.

Substrate route
  1. Grow— Pull a controlled single crystal from purified melt.
  2. Slice— Cut the ingot into discs while limiting damage.
  3. Shape— Control edge, thickness, flatness, and orientation.
  4. Polish— Prepare an exceptionally smooth working surface.
  5. Inspect— Screen crystal, geometry, surface, and contamination.

Format compatibility is binary only at the loading port. Productive compatibility also requires edge handling, robot centering, chuck behavior, thermal response, backside condition, and recipe windows that remain uniform over the usable surface. Track blank-wafer acceptance separately from finished-wafer yield: a substrate can pass incoming inspection yet interact with later thermal or film steps. The audit question is therefore not simply whether a supplier makes the correct diameter, but which substrate attributes are causally linked to each process family and product.

The blank wafer is the shared physical interface between Matter and Precision.
02

Chemistry that builds a device

Semiconductors are repeatedly added, patterned, removed, cleaned, and measured using tightly controlled materials delivered at point of use.

Spread 04 / Conductors and joints

Electrical path

Current crosses many material regimes

The path from grid connection to transistor is built from conductors, contacts, barriers, solders, and plated interfaces.

Copper and aluminum dominate many bulk electrical paths, but the journey narrows through busbars, cables, printed-circuit traces, package planes, bumps, vias, and on-die interconnect. Each scale imposes different requirements for conductivity, adhesion, electromigration, thermal expansion, corrosion, and manufacturability.

Tin-bearing solders join components; tantalum and other materials can serve specialized electronic roles; plating and barrier layers manage interfaces that would otherwise react or diffuse. A rack therefore depends on a hierarchy of metallurgical systems, not a single copper supply. Reliability is often decided where unlike materials meet and repeatedly heat, cool, flex, or carry dense current.

AI relevance: As power density and signaling speed rise, material interfaces become system limits: excess resistance creates heat, while weak joints create intermittent failures.
Interface failure vocabulary
Contact resistance
Electrical loss created at a joint or boundary rather than along the bulk conductor.
Electromigration
Material transport driven by current density that can open a path or create a short.
Thermomechanical fatigue
Damage accumulated when joined materials expand differently during repeated temperature cycles.
Intermetallic growth
Reaction-layer change at a metallic joint that can alter resistance and mechanical integrity over time.

Dependency map

A component map reveals upstream exposure

Import reliance is a national trade measure, not proof that a component is globally unavailable.

USGS maps minerals including tantalum and tin into data-center equipment and reports substantial U.S. net import reliance for several inputs. The measure compares domestic consumption with net imports; it does not by itself show inventories, allied supply, recycling, or which particular device would be constrained first.Claim

A useful resilience analysis moves from element to function. It asks where the material is refined, which grade is needed, which suppliers are qualified, how much is embedded in inventory, and whether a design could use another process or component. That functional view prevents both complacency and exaggerated scarcity claims.

Material role, failure question, and possible response
RoleQuestionResponse path
Bulk powerCan conductors and terminations carry planned load?Resize, parallel, or redesign distribution
Fine interconnectCan films meet resistance and reliability targets?Change stack or process integration
Assembly jointCan the interface survive thermal cycling?Alter alloy, geometry, or underfill
Audit the electrical path at its interfaces
BoundaryDecision metricFailure signal
Cable to busbarTemperature rise, torque retention, and fault dutyHot spots or discoloration
Board to packageInsertion loss, current density, and cycle lifeIntermittence or margin loss
Die to packageResistance, voiding, warpage, and stressParametric drift or open joints
Metal to dielectricAdhesion, diffusion control, and line integrityDelamination, leakage, or shorts

Spread 05 / Gases, resists, and slurries

Process inputs

A fab consumes recipes, not commodities

Films and features emerge from materials delivered with controlled composition, pressure, temperature, and timing.

Deposition precursors help form insulating, conducting, and semiconducting layers. Dopant and carrier gases modify electrical behavior. Etch chemistries remove selected material; cleaning agents reset surfaces; photoresists translate an optical image into a temporary chemical pattern; polishing slurries flatten a layer before the next sequence begins.

Naming a chemical is not enough to establish substitutability. Water content, particles, trace metals, molecular distribution, container history, and delivery hardware can change process behavior. Many inputs are blended or filtered close to use and connected through dedicated gas cabinets, chemical distribution, abatement, monitoring, and emergency systems. Material supply and facilities engineering therefore meet at every tool.

Precursor
A chemical that reacts to form or modify a film.
Photoresist
A light-sensitive material used to define a temporary pattern.
Slurry
A controlled liquid-abrasive mixture used during planarization.
Abatement
Equipment that treats hazardous process exhaust before release.
A process-chemical ledger links function to control
FamilyProcess functionControl boundary
Bulk and carrier gasesPurge, inert, transport, or condition a chamberPurity, flow calibration, leak detection, and supply continuity
Precursors and dopantsBuild a film or alter electrical behaviorComposition, dose, container history, and exhaust treatment
Etchants and cleansRemove selected material or residueSelectivity, compatibility, endpoint, exposure, and abatement
Resists and slurriesTransfer patterns or planarize a surfaceShelf life, filtration, particle load, dispense, and lot matching

Cadence

The same families return layer after layer

Small variation can repeat across a long route and turn into systematic yield loss.

Leading-edge wafers move through thousands of fabrication steps over weeks, according to Intel's manufacturing description. Exact routes differ, but the claim explains why material consistency matters: deposition, patterning, etch, cleaning, modification, polishing, and measurement recur many times before a wafer leaves the fab.Claim

A contaminated lot can affect more than the operation where it enters. It may change adhesion, leave residue, alter a later etch, or produce defects detectable only after additional value has accumulated. Traceability must therefore connect supplier lots, containers, distribution lines, tool chambers, recipes, wafers, and final test outcomes.

Recurring material cycle
  1. Add— Grow or deposit a controlled layer.
  2. Pattern— Coat, expose, and develop resist.
  3. Remove— Etch, strip, or polish selected material.
  4. Clean— Prepare the surface without introducing damage.
  5. Verify— Measure composition, geometry, and defectivity.
Change-control questions before a chemical substitution
  • Does the proposed material change only the active molecule, or also solvent, stabilizer, concentration, container, valve, or filter?
  • Which chamber seasoning, endpoint, residue, defect, and downstream reliability signatures could move?
  • Can facilities safely store, distribute, detect, isolate, and abate the revised chemistry at production flow?
  • Which lots, tools, and products form the qualification boundary, and what evidence releases wider use?
  • What is the rollback plan if yield changes after several dependent process steps?

Spread 06 / Critical minerals

Specialty inputs

A small mass can stop a large machine

Criticality comes from function and supply structure, not simply from tonnes consumed.

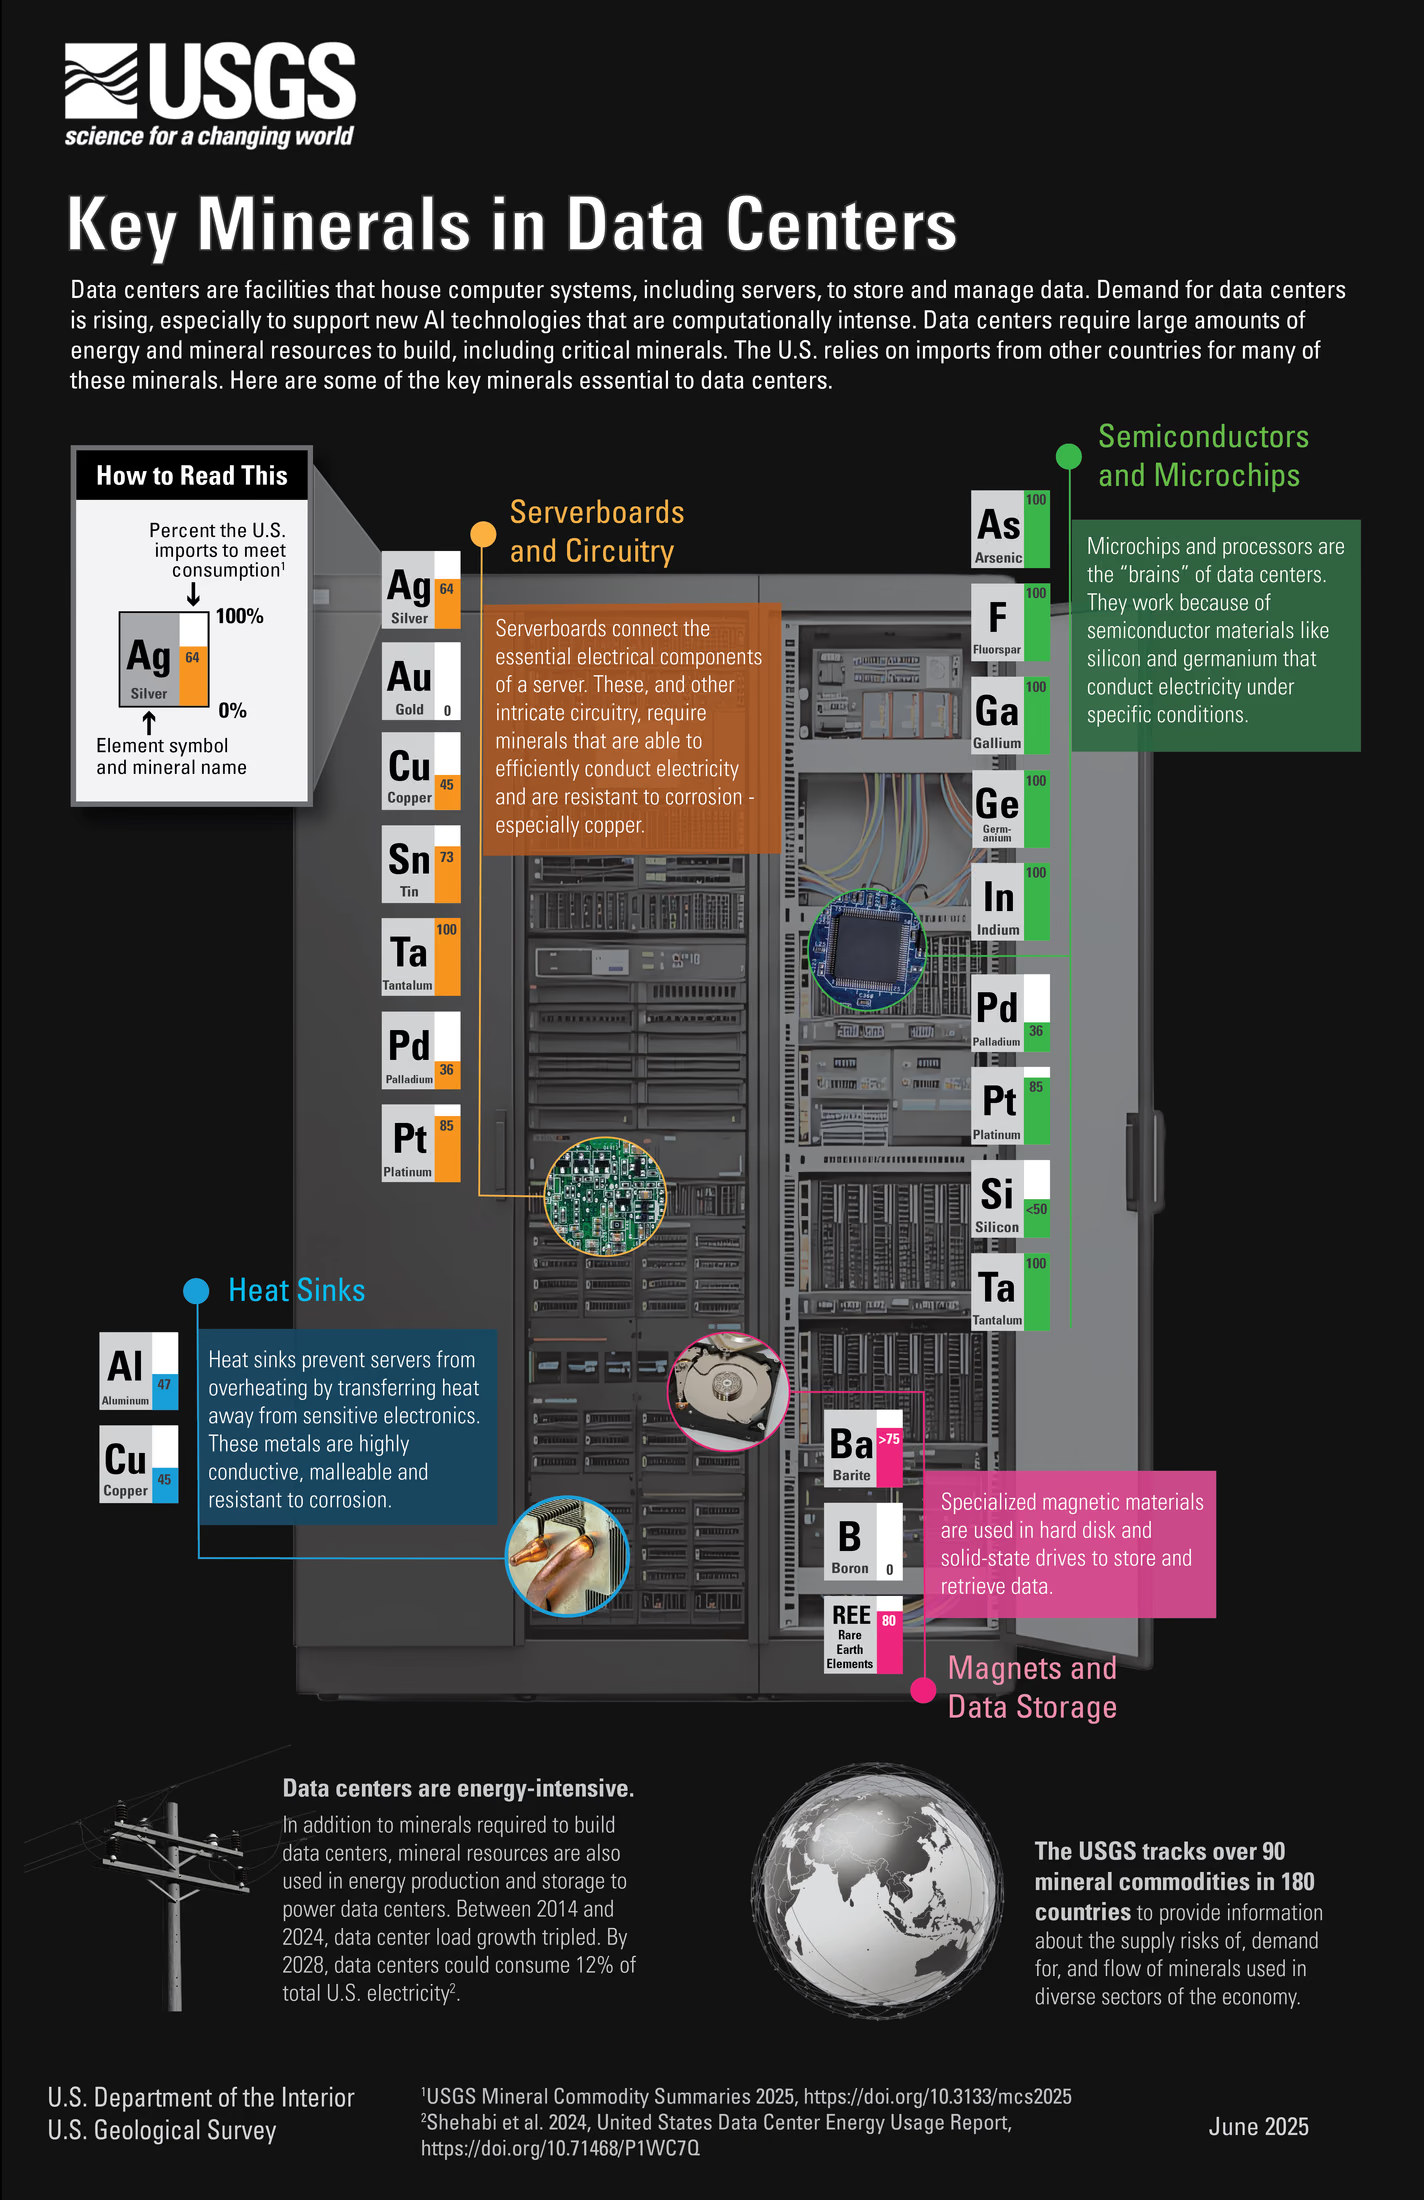
USGS infographic mapping minerals to data-center components and U.S. import reliance.

This government infographic maps selected mineral inputs to data-center components and U.S. import reliance.Claim

The graphic is a component-and-trade map, not a complete AI bill of materials or a forecast of shortages.USGS marks the media item public domain. The local file is a resized AVIF derivative of the original PNG.Eliza Malakoff / U.S. Geological Survey, public domain.Original sourceU.S. government work / public domain

Gallium, germanium, indium, tantalum, tin, rare-earth elements, fluorspar, and arsenic appear in specialized electronic, optical, soldering, magnet, and manufacturing functions. Their physical quantity can be modest relative to steel or concrete, yet losing one qualified grade may interrupt a much larger product flow.

Critical-mineral language can obscure the real bottleneck. The constraint may be mining, but it can also be by-product recovery, refining, a high-purity conversion step, environmental permitting, a single qualified supplier, or geopolitical restrictions. The remedy depends on locating that exact gate.

Many specialty inputs are recovered as by-products, so their supply response follows the economics and operating rate of a larger host-metal chain. A higher specialty-material price may not justify opening or expanding the host operation, and recovery can still depend on whether the relevant intermediate is captured. Map resource, host production, recovery circuit, refining grade, and device conversion separately. The decisive constraint may be a circuit that was never installed, a residue that is not collected, or a refiner unable to meet electronic specifications.

Concentration

Gallium shows the difference between ore and output

Production concentration often forms in conversion capacity rather than in the location of all possible resources.

USGS estimated that China accounted for about ninety-eight percent of worldwide primary low-purity gallium production in 2024. The estimate concerns a specific production stage and grade. It should not be read as a claim that all gallium resources sit in one country or that every AI accelerator contains the same quantity.Claim

USGS also reports complete U.S. net import reliance for six listed inputs used in data-center semiconductors, plus significant reliance for others. Net import reliance describes a national consumption balance. It is a warning to investigate refining, inventories, allied sources, qualification, and recycling—not a self-executing forecast of disruption.Claim

Risk test: Ask which function fails, at which conversion step, after what inventory horizon, and with which qualified substitute. Without those four answers, a scarcity claim is incomplete.
Supply measures that must not be conflated
Resource
Material identified geologically; it is not evidence of economic or permitted production.
Primary production
New material recovered from ore, brine, or a host-processing stream.
Refined capacity
Ability to produce a specified grade, subject to feed, yield, and operating rate.
Import reliance
A national trade balance measure, not a direct measure of global scarcity or firm inventory.
Qualified supply
Deliverable material approved for the particular customer process and product boundary.
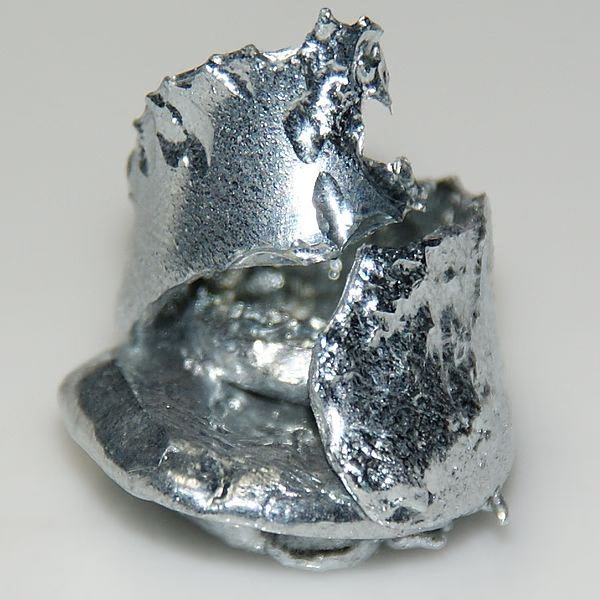
A silvery piece of solid elemental gallium with an irregular folded surface.

Elemental gallium makes a normally abstract supply-chain dependency physically legible.

The specimen is contextual: semiconductor inputs require controlled compounds, purity, form, qualification, and delivery beyond the element shown.USGS marks the item public domain. It shows elemental gallium, not semiconductor-grade material, a gallium-arsenide wafer, or a gallium-nitride device.U.S. Geological Survey, public domain.Original sourceU.S. government work / public domain

Spread 07 / Water and contamination

Ultrapure water

Cleaning is a manufacturing operation

Water used at the wafer surface is engineered to remove contamination without becoming a new source of it.

A fab draws ordinary source water into a treatment train that removes suspended solids, dissolved ions, organics, microbes, and gases. Distribution loops keep ultrapure water moving through compatible piping toward points of use. At the wafer, rinsing and cleaning must clear residues and particles while avoiding corrosion, watermarking, or surface damage.

Because the wafer route repeats over thousands of steps, water quality is not a one-time specification. Sensors, sampling, filters, polishing stages, and return-loop control maintain it continuously. The same facility also manages process wastewater streams whose chemistry and reuse potential differ from the incoming ultrapure-water system.Claim

Boundary: Fab process water and data-center cooling water are different systems. Any comparison must state the facility type, accounting boundary, climate, and treatment route.

Representative fab water-demand allocation

NIST's 2024 programmatic assessment reports this planning split from 2021 fab information. It is a government synthesis, not a universal recipe: facility design, climate, process mix, reuse, and accounting boundaries can materially change the proportions.
SharePercent of water demand
View chart values
Representative fab water-demand allocation — underlying values in Percent of water demand
CategoryShare
Process48% Percent of water demand
Cooling23% Percent of water demand
Abatement20% Percent of water demand
UPW treatment loss9% Percent of water demand

Data status: representative allocation using 2021 information; compare facilities only after normalizing reuse and boundary definitions.

Control loop

Contamination becomes a data problem

A particle matters only when teams can connect it to a source, affected material, and corrective action.

Contamination control spans clothing, airflow, surfaces, materials, containers, tools, and human behavior. It also spans time: a defect observed at inspection may originate in an earlier chamber, chemical lot, maintenance event, or handling step. Wafer genealogy makes those relationships searchable.

KLA's manufacturing overview describes inspection, metrology, and analysis as a feedback loop for detecting defects and controlling yield. The loop is important to materials because it turns an invisible change in chemistry or cleanliness into evidence that can contain affected lots and guide a process correction.Claim

Excursion response
  1. Detect— Find an abnormal particle, film, dimension, or device result.
  2. Trace— Connect wafers to tools, materials, time, and maintenance history.
  3. Contain— Hold potentially affected lots and isolate the source.
  4. Correct— Adjust material, equipment, recipe, or procedure.
  5. Verify— Prove the signal has returned to control.
Contamination-control evidence chain
  • Define the contaminant, source mechanism, transport path, sensitive process, and observable defect signature.
  • Place measurements at incoming water, treatment stages, points of use, tool exhaust, and return streams rather than relying on one plant average.
  • Tie detection limits and sampling frequency to the excursion speed and the amount of work at risk.
  • Preserve lot, tool, filter, maintenance, and operator traceability so containment is narrower than a factory-wide hold.
  • Verify that corrective action removes the source instead of only improving a downstream reading.
03

Materials at machine and campus scale

AI hardware does not end at the die: conductors, structures, thermal systems, and storage materials carry computation into an operable facility.

Spread 08 / Steel, concrete, and enclosure

Built mass

Compute arrives by the tonne

Concrete, steel, aggregate, roofing, enclosure, and cable support turn a site into controlled industrial space.

Foundations spread concentrated equipment loads and stabilize precision machinery. Structural frames carry roofs, mechanical systems, cable pathways, and sometimes multiple floors of computing equipment. Enclosures manage weather, dust, humidity, security, and fire boundaries. The material system extends outside the building into roads, drainage, substations, cooling yards, utility corridors, and perimeter works.

The mix changes by facility. A fab emphasizes vibration control, cleanroom support, chemical utilities, and dense process equipment. A data hall emphasizes rack loads, electrical distribution, heat removal, maintainable pathways, and repeatable modules. In both, embodied material choices interact with construction schedule, local supply, labor productivity, operating efficiency, and eventual adaptation or decommissioning.

Design questions
  • What loads and vibration limits must the structure carry?
  • Which systems must remain replaceable without disturbing operations?
  • Which materials are locally available and already qualified by code?
  • Can future power and cooling paths fit inside the original envelope?
A structural BOM needs more than tonnage
  • Separate permanent works, temporary works, equipment supports, utility racks, fit-out, and later expansion allowances.
  • Record strength, stiffness, vibration, fire, corrosion, cleanliness, and constructability requirements by zone.
  • Attach quantities to design maturity, takeoff date, waste allowance, and procurement status instead of presenting one timeless mass.
  • Identify long-lead members, embeds, specialty coatings, and interfaces that gate tool move-in or energization.
  • Track embodied impacts and local sourcing without assuming a nominally local product has a local upstream route.

Industrial project

The building is part of productive capacity

A tool or rack cannot operate until its surrounding utilities and physical tolerances are commissioned together.

Intel's representative description of an advanced fab includes roughly twelve hundred production tools and fifteen hundred utility-support tools. The point is not a universal equipment count; it is the scale of coordination behind apparently simple wafer output. Floors, overhead systems, utility plants, controls, and material delivery all participate in production.Claim

The same vendor characterizes a modern fab as a project measured in years and roughly ten billion dollars. Actual facilities vary, but the statement illustrates why late material redesign, missing utility capacity, or qualification failure can have capital consequences far larger than the input itself.Claim

No generic material intensity: Do not extrapolate tonnes of steel, concrete, or copper from a universal ratio. Architecture, site, redundancy, code, and project phase must be defined first.
Turn installed mass into qualified capacity
  1. Design— Translate equipment loads, vibration limits, utilities, hazards, and future change into coordinated drawings.
  2. Procure— Release materials against verified quantities, specifications, lead times, and inspection plans.
  3. Install— Control tolerances, embeds, cleanliness, access, and sequence at every trade interface.
  4. Commission— Test structure and utility paths under representative loads before sensitive equipment qualification.
  5. Baseline— Retain as-built conditions and acceptance data so later drift or modification is detectable.

Spread 09 / Power and thermal materials

Energy path

Power density is a material problem

Every watt crosses conductors and conversion stages before becoming compute, then leaves as heat through interfaces and fluids.

Transformers, switchgear, busways, cables, power shelves, boards, package planes, and on-die interconnect progressively divide and condition electrical power. Conductor cross-section, insulation, contact quality, magnetic materials, semiconductor switches, and physical routing determine loss, temperature rise, fault behavior, and serviceability.

Open Compute Project workstreams discuss future rack envelopes extending from very high hundreds of kilowatts toward a megawatt alongside liquid-cooling standards. That is a roadmap, not a statement of widespread deployment, but it shows why material selection and connector design cannot be separated from system architecture.Claim

Energy becomes heat
  1. Deliver— Conduct and transform power into the rack.
  2. Convert— Regulate voltage near boards and packages.
  3. Compute— Switch transistors and move data.
  4. Capture— Move heat through interfaces and cold plates.
  5. Reject— Transfer heat from facility loops to the environment.
Keep four electrical limits distinct
Connected load
The sum of rated equipment demand; it is not the same as coincident operating demand.
Peak demand
The highest observed or modeled coincident load over a defined interval and boundary.
Energy
Power integrated over time, used for operating cost and resource accounting.
Power quality
Voltage, frequency, harmonic, transient, and ride-through conditions that determine usable delivery.
Thermal headroom
Remaining heat-removal capability at stated inlet, flow, ambient, and redundancy conditions.

Thermal path

The interfaces decide whether cooling works

A coolant loop is only as effective as the contact surfaces and joints between silicon and the final heat sink.

Heat moves from die through package lids, thermal-interface materials, cold plates or heat sinks, manifolds, facility water loops, and heat-rejection equipment. Flatness, contact pressure, wetted-material compatibility, corrosion control, seals, hose behavior, and fluid chemistry all affect performance and reliability.

USGS's data-center map links numerous mineral inputs to electronics, power equipment, cooling, and storage components. A design can reduce exposure by using less material, increasing component life, enabling repair, or qualifying alternate technologies. Yet substitutions can move the burden elsewhere—for example into different processing, reliability, or energy requirements.Claim

Handoff: Thermal materials connect package design, rack mechanics, facility water chemistry, maintenance practice, and local heat-rejection conditions.
Thermal-interface failure modes and observables
InterfaceFailure modeEvidence
Die to lidVoid, pump-out, or uneven contactThermal resistance and temperature spread
Lid to cold plateFlatness, pressure, or alignment lossHot-spot drift under matched load
Cold plate to loopFouling, corrosion, leak, or flow imbalancePressure, chemistry, flow, and inspection trend
Facility loop to rejectionCapacity or approach-temperature limitSupply/return temperatures and rejected heat

Spread 10 / Qualification and useful life

Acceptance

Specification is necessary; qualification is decisive

Two materials can match a datasheet yet behave differently inside a tightly coupled process or assembly.

Qualification begins by defining the function and failure modes: electrical performance, purity, adhesion, corrosion, outgassing, particle generation, thermal cycling, mechanical stress, or shelf life. Teams compare incoming characterization, controlled trials, in-process measurements, reliability testing, and finished-device results before widening use.

A globally specialized supply chain makes these relationships important. Design, materials, tools, fabrication, packaging, and system assembly often occur in different clusters. A supplier change can therefore cross organizational and geographic boundaries, requiring coordinated validation and traceability rather than a simple procurement substitution.Claim

Qualification record
  • Material identity, grade, and supplier process
  • Critical-to-quality measurements and acceptance limits
  • Tool, recipe, package, or system contexts tested
  • Reliability evidence and known failure boundaries
  • Change-control and requalification triggers
Qualification should close a stated risk
  1. Bound— Name the material, supplier site, grade, container, tool, recipe, product, and operating window covered.
  2. Hypothesize— List plausible failure mechanisms and the measurements able to reveal them.
  3. Compare— Run controlled lots against a stable reference while preserving genealogy and confounders.
  4. Stress— Test reliability and excursions near the intended boundary, not only nominal performance.
  5. Release— Set approval, surveillance, change-notification, rollback, and requalification triggers.

Lifecycle design

Longer service preserves embedded work

The highest-value material strategy may be to avoid discarding a working component before its useful role is exhausted.

A finished accelerator embodies refining, wafer production, fabrication, packaging, assembly, transport, and testing. Repair, component reuse, workload reassignment, and secondary deployment can preserve more of that accumulated value than immediate material recovery. Those options depend on diagnostics, documentation, modularity, spare parts, secure data handling, and compatible software.

SIA's value-chain overview ends with assembly and integration into products, but operational planning should continue through maintenance, refresh, and retirement. Materials selected for performance also shape disassembly, recycling economics, worker exposure, and downstream accountability. Lifecycle criteria belong in early design reviews, when interfaces and service paths can still change.Claim

Priority order: Where safe and practical: maintain, repair, redeploy, harvest components, then recover materials. Each step preserves a different share of embedded value.
Lifecycle decision boundary
  • Maintain when diagnostics show a known, repairable degradation and service risk remains controlled.
  • Redeploy when the asset misses its original target but meets a lower-duty workload with support and security intact.
  • Harvest components only when identity, remaining life, test coverage, and configuration control follow the part.
  • Recycle when functional recovery is no longer safe or economic and a documented material route exists.
  • Dispose only through a compliant path for fractions that cannot be safely reused or recovered.
04

Geography, resilience, and return

Resilience comes from knowing where transformation occurs, qualifying alternatives before disruption, and keeping physical flows visible through retirement.

Spread 11 / Concentration and chokepoints

Geography

Map transformations, not flags

Country-level labels can hide the precise facility, process step, ownership, and transport corridor that create dependence.

Semiconductor activity remains distributed among specialized regional clusters. That specialization can make the chain efficient and innovative, but it also means an input may cross several borders between extraction, refining, conversion, wafer fabrication, packaging, and final assembly. A national production total rarely describes the full route.Claim

A useful map identifies facility location, process capability, capacity that actually meets specification, upstream dependencies, customer qualifications, ownership, and critical logistics. It also distinguishes a temporary outage from a structural shortage. The goal is not to label every concentration dangerous; it is to understand which concentration lacks a credible bridge when conditions change.

Four kinds of concentration
TypeWhat to locateTypical blind spot
ResourceOre, brine, or recoverable by-productResource may lack conversion capacity
RefiningFacilities producing required gradeNameplate output may not meet specification
QualificationApproved suppliers and formulationsNominal substitutes need validation
LogisticsPorts, routes, containers, and storageA route can be the single point of failure
Map concentration at the stage that can stop production
StageCapacity denominatorBridge question
ResourceRecoverable feed with economic and legal accessCan another deposit reach conversion in time?
RefiningSaleable output at the required gradeIs feed, reagent, energy, and waste capacity available?
ComponentUsable form factor and process capabilityCan tooling and customer specifications accept it?
QualificationApproved volume for the target productHas the alternate run production-equivalent evidence?
LogisticsProtected throughput over viable routesWhich corridor, package, or permit is singular?

Comparative evidence

Different statistics answer different questions

Supplier share, production share, and import reliance cannot be used interchangeably.

SIA's estimate that two firms supply roughly three quarters of semiconductor-grade polysilicon concerns qualified feedstock suppliers. USGS's estimate that China produced about ninety-eight percent of primary low-purity gallium concerns a production stage and grade. Neither number alone describes the whole downstream market.ClaimClaim

The classification matters. The polysilicon share is presented as a stakeholder position from an industry filing; the gallium share is a government estimate. Both are time-sensitive snapshots. Strong analysis keeps those labels, dates, and boundaries attached as the numbers move from the evidence ledger into a narrative or decision.

Interpretation: Concentration signals where to investigate. It does not, without inventory, qualification, demand, and substitution analysis, measure the probability or duration of a shortage.

Every concentration statistic needs a numerator, denominator, stage, grade, geography, period, and method. A supplier share may describe revenue while a production share describes mass; import reliance is national and can coexist with diverse foreign sources. Before assigning risk, add inventory, spare capacity, switching lead time, demand elasticity, ownership, and correlated upstream dependencies. The audit should also record what would falsify the concern: an approved second source, demonstrated surge output, a design substitution, or a logistics route that has been exercised rather than merely identified.

Spread 12 / Circularity and e-waste

Return path

Retirement is another supply chain

Used equipment carries recoverable material, residual value, hazardous fractions, sensitive data, and an obligation to know where it goes.

The Global E-waste Monitor estimates that the world generated sixty-two million tonnes of electronic waste in 2022. That total covers all types of electronic waste, not an AI- or data-center-specific share. It provides a global context for why equipment refresh should include documented reuse, data destruction, downstream processing, and recovery routes.Claim

Data-center equipment is not one material stream. Racks, servers, boards, storage devices, batteries, cables, cooling hardware, and construction systems have different hazards, values, and recovery processes. Asset identity must remain connected to custody, condition, sanitization, destination, and treatment evidence if circularity is to mean more than removal from the site.

Responsible disposition
  1. Inventory— Record asset identity, condition, and data sensitivity.
  2. Sanitize— Apply verified data-destruction procedures.
  3. Triage— Separate repair, reuse, parts harvesting, and recycling paths.
  4. Transfer— Use accountable downstream partners and chain of custody.
  5. Verify— Retain evidence of destination and treatment.

Global e-waste estimate and modeled trajectory

The 2022 point is an estimate for all electronic waste; the 2030 point is a projection under the monitor's modeled trajectory. Neither value measures AI infrastructure or data-center retirements specifically.
Global e-wasteMillion tonnes
View chart values
Global e-waste estimate and modeled trajectory — underlying values in Million tonnes
CategoryGlobal e-waste
202262 Mt Million tonnes
203082 Mt Million tonnes

Data status: 2022 estimate and 2030 projection across the whole electronics economy; do not interpolate as measured annual observations.

Forward view

A projection is a reason to design differently

Rising global waste is not an AI forecast, but it sharpens the case for longer-lived, serviceable infrastructure.

The same monitor projects global electronic waste reaching eighty-two million tonnes in 2030 under its modeled trajectory. The number is a projection across the whole electronics economy, not a claim about future accelerator retirements. Its value here is to place AI infrastructure inside a larger material-management challenge.Claim

Design decisions determine which return paths remain possible. Replaceable power supplies, documented fasteners, accessible cooling connections, modular storage, firmware support, and durable diagnostic records can make repair or reuse practical. Bonded assemblies, proprietary interfaces, missing parts, and uncertain data handling can push working material prematurely toward shredding or disposal.

Projected global electronic waste in 2030 across all equipment categories
82 Mt
Evidence class
projection
Claim
claim-ewaste-2030
Context
This is not an AI-specific projection.
Accounting boundary: Never present total global e-waste as data-center waste. Track AI equipment by asset class, owner, geography, year, and verified disposition.
Recovery claims need a physical denominator
MetricWhat it demonstratesWhat it omits
Collected massMaterial entered a documented channelFinal treatment and recovery yield
Recycling rateA share reached a defined recycling stageFunctional reuse and material quality
Recovered outputSecondary material left the processWhether it displaced primary input
Reuse countAssets or parts returned to serviceRemaining life, duty, and later disposition

Spread 13 / Resilience and handoff

Operating discipline

Resilience is prepared optionality

An alternative that has never been qualified, contracted, transported, or exercised is only a hypothesis.

Specialized regional clusters connect design, materials, equipment, fabrication, and assembly. Resilience can come from diversified facilities, transparent sub-tier mapping, strategic inventory, alternate logistics, compatible designs, and reciprocal capacity. Each option has a cost and a lead time, so teams should choose according to the failure mode they are actually trying to absorb.Claim

Preparedness should be tested as an operating capability. Can the buyer identify affected lots? Has a second source run through the real process? Is the alternate container compatible with delivery hardware? Are shelf life and storage conditions known? Does a design change shift risk into power, yield, cooling, or reliability? Answers belong in decision records before a disruption compresses the timeline.

Resilience portfolio
  • Visibility into processors, grades, routes, and qualified sites
  • Inventory tied to shelf life and realistic recovery time
  • Second sources proven in production-equivalent conditions
  • Design alternatives with quantified performance tradeoffs
  • Recovery plans rehearsed across suppliers and operators
Evidence that optionality is operational
  • The alternate has a named site, process route, grade, committed volume, transport path, and owner.
  • Production-equivalent material has passed the intended tools, products, reliability tests, and change-control review.
  • Inventory is matched to shelf life, storage conditions, affected demand, and realistic recovery time.
  • A disruption exercise has tested ordering, allocation, customs, receiving, line changeover, containment, and rollback.
  • Tradeoffs in yield, throughput, power, cooling, reliability, cost, and waste are visible to the decision maker.

Transition · Precision

A blank wafer is stored possibility

Matter becomes computation only when design data and factory control repeatedly form working structures on its surface.

The common 300-millimeter wafer format arrives at a fab as a qualified physical platform. It carries no model architecture by itself. Masks, optical systems, deposition, etch, implantation, cleaning, polishing, metrology, inspection, automation, and skilled process control must turn that platform into known-good die.Claim

SIA's value-chain framing moves from research and design through front-end fabrication, back-end assembly and test, then product integration. The next volume enters the precision stages: how workload choices become geometry, how tools reproduce that geometry, and how yield learning determines whether installed equipment becomes useful AI capacity.Claim

Continue: Volume II · Precision follows the conversion from architectural intent to patterned silicon and known-good die.
Handoff record from material to precision
InputPrecision needs to knowRelease evidence
WaferGeometry, crystal attributes, surface, backside, and genealogyIncoming inspection and process correlation
ChemicalComposition, container, delivery, point-of-use condition, and change historyCertificate plus tool and device qualification
UtilityQuality, pressure, temperature, stability, redundancy, and recoveryCommissioning trend under representative load
FacilityVibration, contamination, environment, automation, and maintenance boundaryBaseline acceptance and excursion response
Matter does not disappear downstream; its constraints remain embedded in every chip, rack, and campus.

Behind the claim

Evidence, in context.

Opening the evidence record…